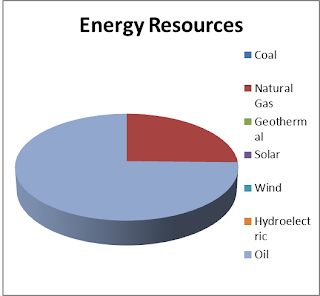
Current resources pie graph
Energy consumption
|
Estimated resources pie graph 2100 We chose to change our graph to this arrangement too
equal
Energy
consumption
|
We choose this arrangement to decrease the amount used by transport and industry and to instead devote it to agriculture and non-energy usage
Food
resources current
|
We chose this arrangement to reduce the resources used to
make heavy water consuming resources such as chicken and milk
|
We chose this arrangement to remove all fossil fuels and to
put natural resources in there place renewable resources like solar wind and
hydroelectric.
For waste there was no data to make a pie graph


No comments:
Post a Comment